Monitor your events in real time and understand your participants. Our platform collects all the data you need to build a database of qualified contacts, measure satisfaction, and calculate ROI and NPS.
All reports are now accessible via a secure link protected by OTP (One-Time Password), ensuring individualized and secure access.


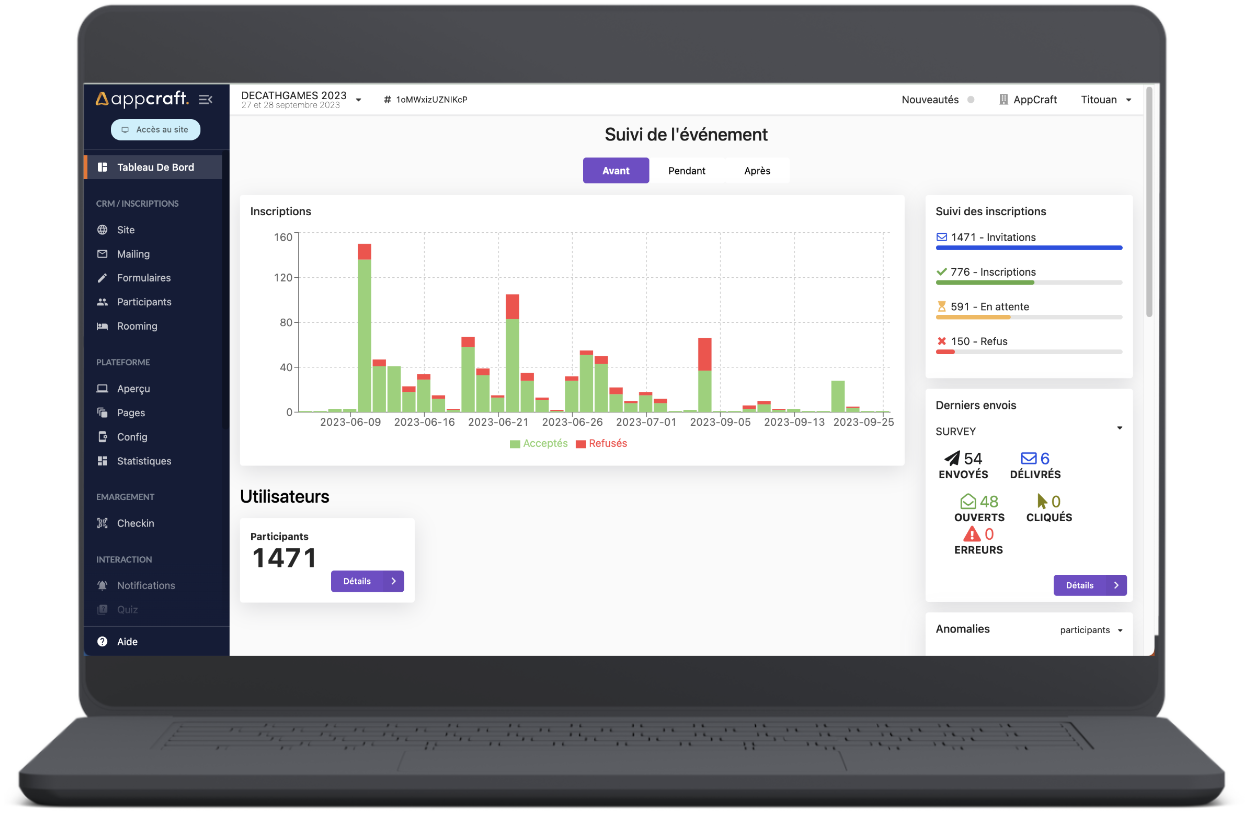
No more outdated Excel exports and repetitive emails. With our SmartHub, you can view your event's performance live (registrations, attendance, engagement). Better yet, create and share customized views for your clients or operational teams, accessible via a simple secure link, always up to date.
Shared reports update dynamically every 30 seconds: no data "freeze," always the most recent version.
Every event manager has their own key performance indicators (KPIs). With SmartHub, you don't have to settle for standard graphs: you can build your own comprehensive dashboard. Aggregate registration, attendance, and mobile engagement data on a single screen to get a 360° view of your event's health at a glance.
• Clear and intuitive overview: view the progress of your events in real time.
• Key performance indicator (KPI) tracking: stay on top of every important metric.
• Informed decisions: optimize organization and maximize the impact of your event.
• Strategic management: anticipate needs and adjust your actions for guaranteed success.
AppCraft has designed its event statistics module to provide a comprehensive and detailed overview of each event. With this solution:
• Track interactions and engagement of participants (surveys, Q&A, group discussions).
• Analyze traffic, downloads, and B2B appointments to optimize the experience.
• Measure the effectiveness of registrations and email campaigns in real time.
• Poll live: view your participants' responses and trends in real time.
• Analyze Q&As: understand which questions generate the most engagement.
• Follow group discussions: identify the topics that your audience is passionate about.
• Optimize interaction: adjust your content and activities to maintain attention throughout the event.

Follow each interaction and enhance your participants' experience
• Real-time analysis: see how much time is spent on live events and how many pages are viewed.
• Track downloaded content: identify which documents generate the most interest.
• Appointments and networking : measure interactions between participants and exhibitors.
• Response and engagement rates: understand what works to optimize the overall experience.
• Maximize the impact of your event by adjusting your content and activities based on observed behaviors.
• Real-time tracking: instantly view registration conversion rates.
• Email analytics: track opens, clicks, and interactions to understand what works.
• Identify areas for improvement: adjust your campaigns to maximize impact and engagement.
• Boost your results: turn every email and registration into a concrete opportunity for your event.
Streamline logistics with your service providers.
No more "Listing_Final_v12.xlsx" files sent by email.
Create specific views (e.g., list of train arrivals, list of dietary requirements) and generate a secure web link to share with third parties (drivers, hotels, caterers). These lists are updated in real time.
When sharing a report, you can set certain columns as "editable." For example, allow your travel agency to enter train ticket numbers directly into your participant database, or allow the hotel to validate check-ins, or allow the driver to check "passenger picked up" for perfect operational tracking.
Your service provider has secure access to data in real time without needing an administrator account on the platform. It is a true collaborative work tool that eliminates back-and-forth emails and data entry errors.
For events with invitation systems and guests, AppCraft now offers an "Inviter/Invitee" reporting mode.
• Each host only has access to the people they have invited
• The report is accessible via a unique link secured by OTP
• The link is embedded directly in the registration confirmation email
• The columns are standardized for all hosts
• The data is dynamic and updated automatically
This module is currently interconnected with the accompanying module.
• In-depth analysis: generate customized reports tailored to your needs.
• Gain valuable insights to optimize your event strategies.
• Make informed decisions and maximize the impact of each of your events.
And if you really need to,easily export your data to Excel, Google Analytics, or your favorite tools.
The ease of sharing must not compromise the security of personal data.
Each shared report is secured by OTP (One-Time Password).
An additional password can be configured, as well as an expiration date for the link.
By selecting only the columns that are necessary for your contact (data minimization), you are fully complying with GDPR principles, avoiding the transmission of complete files containing unnecessary sensitive information to the external service providers you work with.
In addition, access is individualized: each user only sees the data that concerns them (e.g., host/guests).
Furthermore, by selecting only the columns necessary for your contact (data minimization), you are fully complying with the principles of the GDPR.
An event statistics module is essential for understanding the overall performance of your events and improving future editions.
It allows you to track key performance indicators (KPIs) such as registrations, engagement, interactions, and B2B meetings in real time, and analyze the effectiveness of your communication campaigns.
With this accurate data, you can identify what works best, measure participant engagement (through surveys, Q&As, discussions, downloads, etc.), and demonstrate the ROI of your actions.
All this information is consolidated in a single, simple, and intuitive dashboard, allowing you to manage your events with precision and efficiency.
To take full advantage of an event statistics module, it is essential to define in advance the indicators that are truly useful for your objectives. Trying to track too much data can hinder readability and make the analysis less relevant. It is better to focus on a few key KPIs that are directly related to the success of your event, such as participant engagement, session attendance, or the effectiveness of your communication efforts.
Another important point is to analyze data throughout the event, not just after it has ended. Real-time monitoring allows you to adjust certain actions, reignite engagement, or optimize the participant experience while there is still time. This approach makes the data immediately actionable.
It is also recommended to contextualize the figures in order to draw concrete lessons from them. Statistics take on their full meaning when cross-referenced with the format of the event, the profile of the participants, or organizational choices. This qualitative interpretation avoids hasty conclusions and makes it possible to identify relevant levers for improvement for future editions.
Finally, statistics and reports must be shared with the relevant teams and integrated into a process of continuous improvement. By promoting the results and explaining the lessons learned from KPIs, you transform data into a powerful management and decision-making tool that improves the overall performance of your events.
The AppCraft statistics module stands out thanks to its comprehensive approach, simplicity, and full integration into the event platform.
It centralizes all data—registrations, engagement, traffic, interactions, email campaigns—in a clear and user-friendly interface.
You can track your KPIs in real time, create custom reports, and easily export your analyses to other tools.
GDPR-compliant and designed in accordance with ISO 20121, AppCraft guarantees you a secure, reliable, and sustainable solution, designed to give meaning to your data and maximize the performance of your events.


